Plotting
Plot Raw
Plots raw EEG data using the MNE raw.plot function.
Attributes
| Input | ||
| Name | Type | Description |
| Raw | rawEEG | Raw EEG data |
Settings Interface
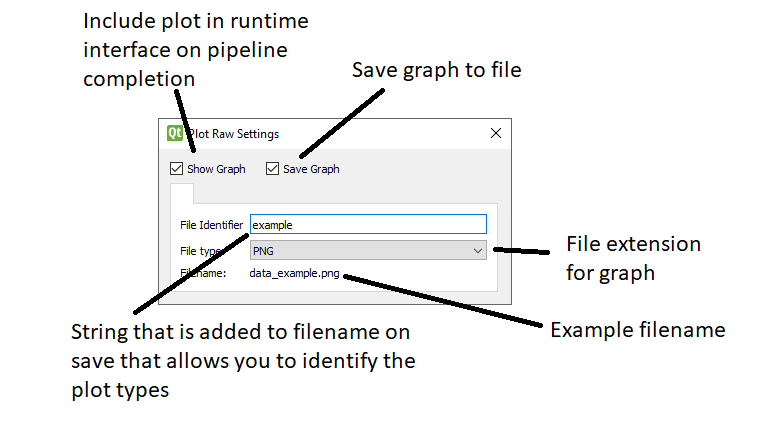
Please note: File identifiers must be unique for each node so as to avoid overwriting each other. If running a batch pipeline, each input file’s output plots will be given a unique name that includes this identifier.
Plot Sources
Plots the sources created from independant component analysis against time using the MNE ica.plot_sources function.
Attributes
| Input | ||
| Name | Type | Description |
| Data | rawEEG/epoch | Raw EEG/epoch data |
| ICA Solution | ICA | ICA solution to apply to data |
Plot Components
Plots the ICA components using the MNE ica.plot_components function.
Attributes
| Input | ||
| Name | Type | Description |
| ICA Solution | ICA | ICA solution to plot components of |
Plot Properties
Plots the properties of each ICA component using the MNE ica.plot_properties function.
Attributes
| Input | ||
| Name | Type | Description |
| Data | rawEEG/epoch | Raw EEG/epoch data |
| ICA Solution | ICA | ICA solution to apply to data |
Plot Peak
Creates a plot of the time series evoked event data for each channel, with a marker showing the peak signal time. The scalp plot at the peak time is shown above the time series data. Uses the MNE evoked.plot_joint function. Creates individual plots for each event given in the global variables
Attributes
| Input | ||
| Name | Type | Description |
| Evoked Data | evoked | Averaged event (evoked) data |
Plot Local Peaks
Creates a plot of the time series evoked event data for each channel, with a marker showing the time of the local peak signal. The scalp plot at the peak time is shown above the time series data. Uses the MNE evoked.plot_joint function. Creates individual plots for each event given in the global variables
Attributes
| Input | ||
| Name | Type | Description |
| Evoked Data | evoked | Averaged event (evoked) data |
Plot Evoked Times
Identical to Plot Peak but gives a scalp plot at regular intervals along the time series.
Attributes
| Input | ||
| Name | Type | Description |
| Evoked Data | evoked | Averaged event (evoked) data |
Plot Evoked Comparison
Plots a comparison of averaged time series data for all channels for each event given in the global variables. This uses the MNE mne.viz.plot_compare_evokeds function.
Attributes
| Input | ||
| Name | Type | Description |
| Evoked Data | evoked | Averaged event (evoked) data |
Grand Average Signal
Plots the grand (combined) average signal for each channel, for each event, averaged across all input files.
Attributes
| Input | ||
| Name | Type | Description |
| Evoked Data | evoked | Averaged event (evoked) data |
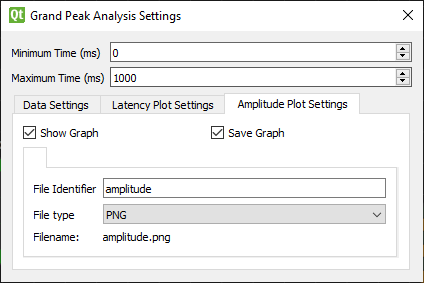
Grand Peak Analysis
Produces bar charts of the mean peak amplitude and latencies for each channel, for each event, averaged across all input files. The standard deviation of each value is given as a y-axis error bar.
Attributes
| Input | ||
| Name | Type | Description |
| Evoked Data | evoked | Averaged event (evoked) data |
Settings Interface